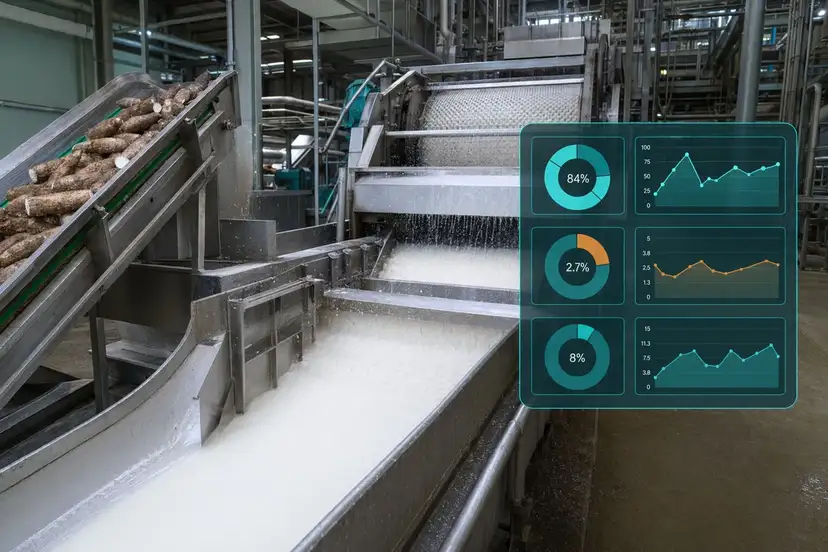
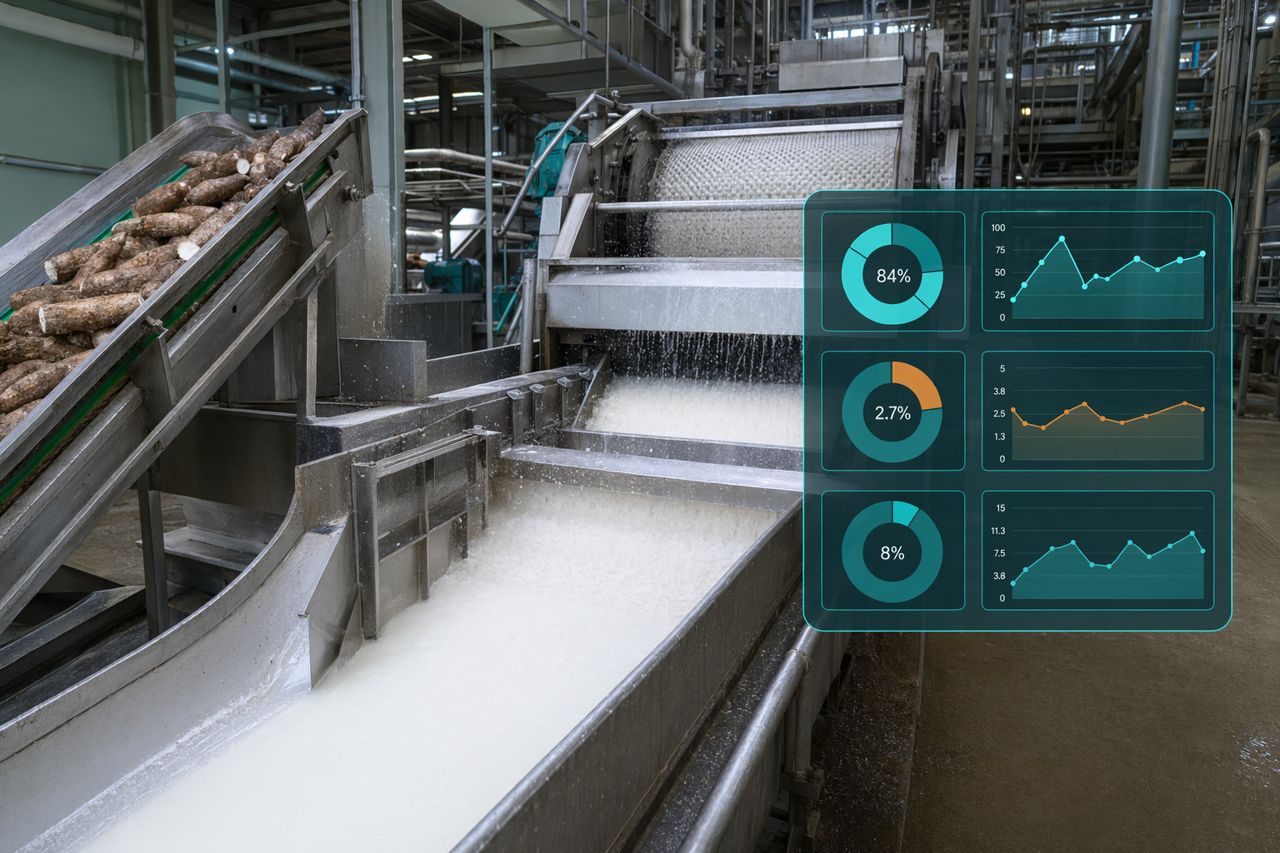
The Cassava Starch Factory KPI Dashboard: Yield, Moisture, Pulp Loss, Water and Downtime
A cassava starch factory does not need more numbers for the sake of reporting. It needs a dashboard that shows where starch is being recovered, where it is escaping, where water is doing unnecessary work, and where process variation is turning into downtime.
For plant managers, production supervisors, quality teams and procurement leads, the right KPI dashboard becomes a control system for daily decisions. It connects root quality, rasping performance, pulp loss, slurry behavior, separation efficiency, dryer load, wastewater pressure and enzyme dosing discipline into one practical operating view.
ManiFlow Catalytics supports factories looking for a dependable enzyme supplier for cassava starch processing with a focus on plant-floor value: steadier slurry, cleaner separation, lower avoidable loss, and fewer surprises when raw material quality changes.
What a useful cassava starch KPI dashboard should answer
A dashboard should help the factory answer five questions every shift:
- Are we recovering the starch we paid for in the roots?
- Is pulp carrying too much recoverable starch out of the process?
- Is slurry viscosity making screens, pumps, hydrocyclones or dryers work harder?
- Are water use and wastewater load rising because separation is unstable?
- Are stoppages linked to raw material variation, dosing gaps, screen blinding, pump strain or cleaning frequency?
The strongest dashboards do not separate quality, yield and uptime. In cassava starch processing, they move together.
The core KPI map: from roots to finished starch
A practical dashboard should follow the process path. That makes it easier for operators to spot where a problem starts, not just where it appears.
1. Fresh root intake and usable starch potential
Start with the incoming material. Root age, variety, storage time, soil load and seasonal conditions can shift process behavior before the first pump turns.
Track:
- Fresh root intake by shift and supplier lot
- Estimated starch potential by root batch
- Soil and peel burden
- Root holding time before processing
- Visual signs of deterioration or fermentation
- Lot-to-lot variation in rasping behavior
Why it matters: a yield drop may not come from the extraction area alone. If root quality shifts, the dashboard should separate raw material risk from equipment or dosing issues.
2. Rasping and liberation performance
Rasping is where the factory starts deciding how much starch will be available for recovery. Poor liberation creates more loss downstream and can make the separation section look worse than it really is.
Track:
- Rasper feed stability
- Rasper load trends
- Fiber particle profile observations
- Starch release consistency
- Maintenance condition of rasping surfaces
- Abnormal vibration or feed interruptions
Dashboard signal: if pulp starch loss rises while hydrocyclone behavior remains normal, check liberation before blaming separation.
3. Pulp loss and screen efficiency
Pulp loss is one of the most direct indicators of money leaving the factory. It should be visible every shift, not buried in a weekly report.
Track:
- Starch remaining in pulp stream
- Screen loading pattern
- Screen blinding frequency
- Wash water distribution
- Fiber carryover
- Cleaning stoppages linked to pulp handling
Operator question: is starch leaving with the fiber because it was never fully released, because the screen stage is overloaded, or because slurry viscosity is making washing less effective?
Slurry behavior: the KPI many dashboards underweight
Cassava starch factories often track tonnage, moisture and quality. Fewer dashboards give enough attention to slurry behavior. That is a mistake.
Slurry viscosity affects:
- Pumping stability
- Screen passage
- Hydrocyclone feed consistency
- Separation sharpness
- Water demand
- Dryer load
- Cleaning frequency
- Operator intervention
Enzyme programs can support viscosity control when applied with dose discipline and process understanding. The goal is not to add complexity. The goal is to help the plant keep flow behavior within a workable window as root quality changes.
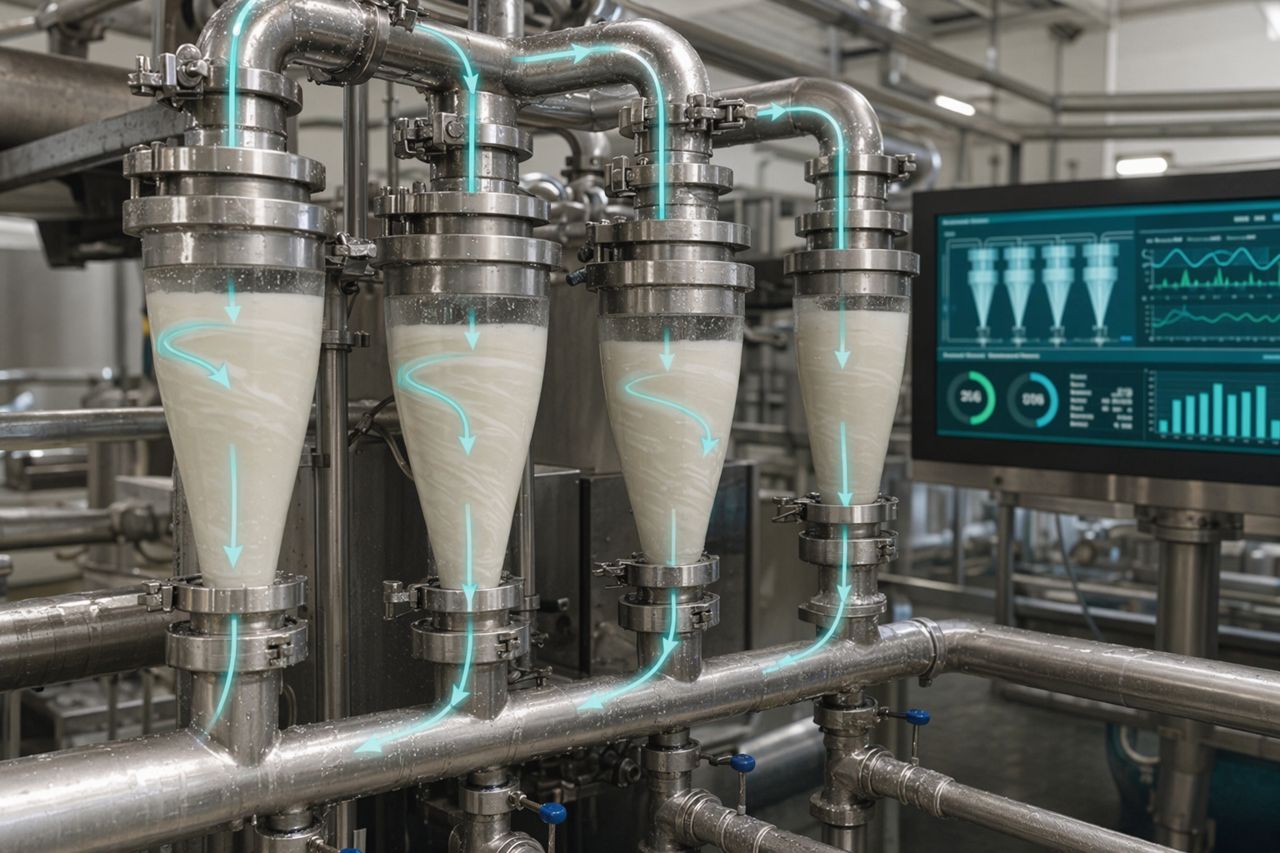
Hydrocyclone and separation KPIs
The separation area is where small shifts in feed behavior become visible. If the feed is unstable, the hydrocyclone system may show swings in clarity, pressure balance, overflow behavior or starch recovery.
Track:
- Feed consistency into the separation train
- Overflow and underflow appearance
- Starch milk concentration trends
- Sand and fiber carryover observations
- Recycle stream burden
- Water addition pattern
- Frequency of operator adjustment
A useful dashboard should not only show separation performance. It should show the upstream reasons separation performance changed.
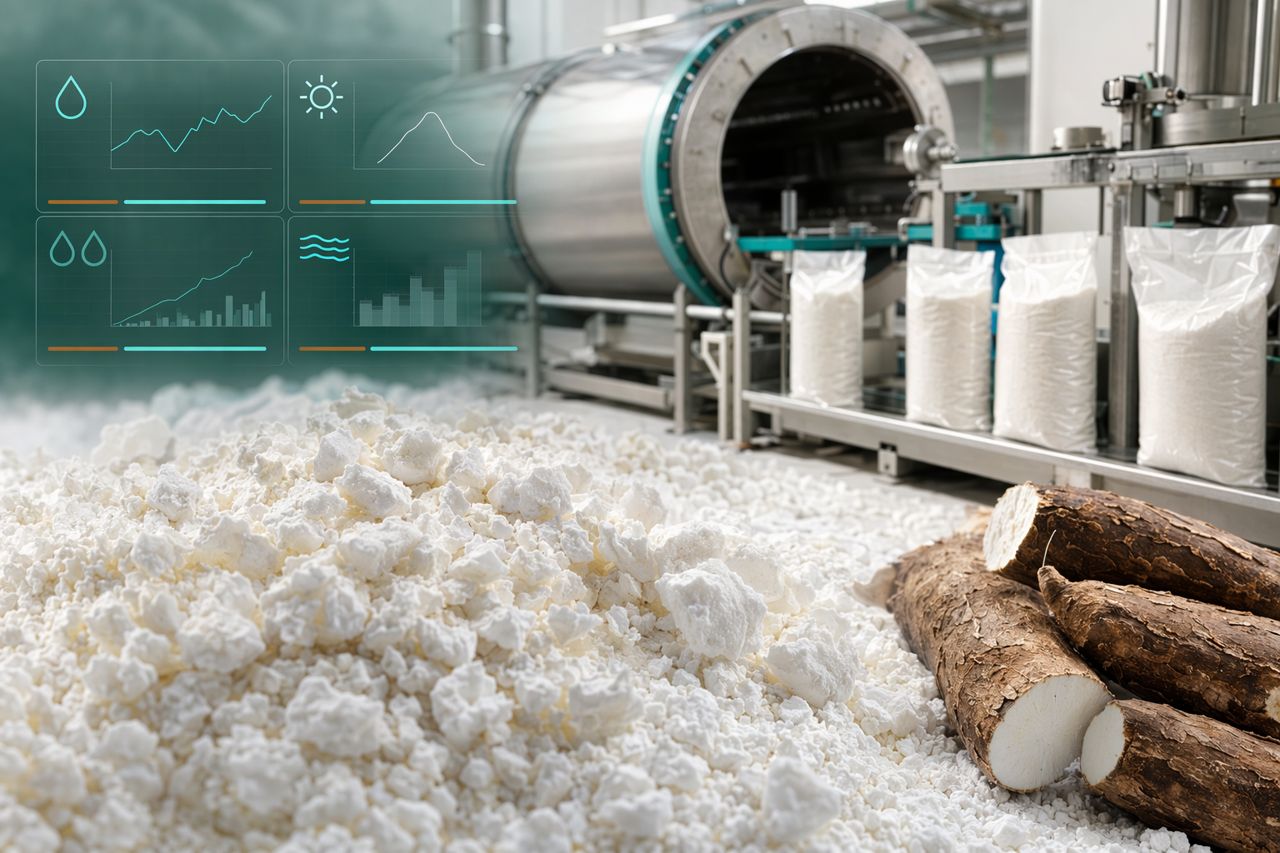
Moisture and dryer load
Finished starch moisture is a quality and logistics KPI, but it is also an energy and throughput signal. If upstream washing and separation are unstable, the dryer may be forced to absorb that variability.
Track:
- Moisture trend by production lot
- Dryer inlet consistency
- Dryer outlet stability
- Rework or hold decisions
- Bagging interruptions linked to moisture variation
- Weather or ambient condition impact
Better upstream control can reduce dryer surprises. When slurry consistency and separation stability improve, the drying section receives a more predictable load.
Brightness and product consistency
Starch brightness is not just a lab result. It reflects raw material quality, washing effectiveness, fiber control, separation cleanliness and process hygiene.
Track:
- Brightness trend by lot
- Color variation across shifts
- Root storage condition
- Peel and fiber carryover
- Wash water condition
- Time between cleaning events
The dashboard should make quality drift visible early enough for action, before finished starch requires downgrade decisions or customer explanation.
Water use and wastewater load
Water is not only a utility cost. In a cassava starch factory, water carries solids, organics, heat, labor and treatment burden. If water use increases while yield does not improve, the process may be compensating for poor separation or unstable slurry.
Track:
- Water use per production period
- Wash water allocation by section
- Recycle water condition
- Wastewater strength indicators
- Settling behavior
- Solids carryover
- Treatment area complaints or overload events
When enzymes help stabilize slurry and improve separation behavior, the plant may be able to reduce unnecessary water movement and lower avoidable wastewater pressure. The dashboard should capture that operational value.
Downtime and intervention KPIs
Downtime is often recorded as a maintenance issue. In starch processing, stoppages may be triggered by process behavior before they become mechanical problems.
Track downtime by cause:
- Screen cleaning
- Pump strain or cavitation complaints
- Blocked lines
- Hydrocyclone instability
- Rasper feed interruptions
- Dryer imbalance
- Cleaning and sanitation hold time
- Dosing pump interruption
- Raw material feed inconsistency
The key is to connect downtime to the process conditions immediately before the stop. If viscosity, pulp load or feed consistency shifted first, the root cause may be operational rather than purely mechanical.
Enzyme dosing KPIs: discipline before spend
A good enzyme program should be managed like a production control point, not as an informal additive. Procurement needs cost control. Production needs reliability. Quality needs consistency. The dashboard should support all three.
Track:
- Dose rate by shift and product target
- Dosing pump run status
- Batch or lot changeover timing
- Enzyme storage condition
- Addition point condition
- Contact time consistency
- Operator deviation notes
- Correlation with pulp loss, flow behavior, separation and downtime
Dose discipline matters because inconsistent addition creates inconsistent value. A lower purchase price is not helpful if supply reliability, handling support or performance consistency creates production risk.
What procurement should see on the dashboard
Procurement teams are often asked to compare enzyme suppliers on price alone. That misses the real buying question: which supplier reduces production risk while supporting measurable plant value?
Procurement should have visibility into:
- Consumption trend versus production volume
- Supplier lead time reliability
- Batch-to-batch consistency feedback
- Storage and handling requirements
- Production impact of delayed supply
- Trial results tied to plant KPIs
- Support response time when process conditions change
A dependable enzyme supplier for cassava starch processing should help the factory document value in terms plant managers and finance teams both understand: recovery, water, downtime, quality consistency and reduced operating friction.
A practical dashboard layout
A strong one-page KPI view can be built in five blocks.
Block 1: Production and raw material
- Root intake
- Root lot quality notes
- Rasper operating status
- Fresh root holding time
- Production rate
Block 2: Yield and loss
- Starch recovered
- Starch in pulp
- Fiber carryover
- Recycle load
- Off-spec or downgrade volume
Block 3: Process behavior
- Slurry viscosity trend
- Pump and screen stability
- Hydrocyclone feed consistency
- Operator adjustments
- Cleaning frequency
Block 4: Utilities and wastewater
- Water use trend
- Dryer load stability
- Wastewater strength indicators
- Solids carryover to treatment
- Utility alarms or constraints
Block 5: Reliability and dosing
- Downtime by cause
- Dosing pump status
- Enzyme consumption versus production
- Supplier delivery status
- Corrective actions completed
This format keeps the dashboard close to daily decisions. It avoids building a report that looks complete but does not change factory behavior.
Red flags your current dashboard is not doing enough
Your factory may need a better KPI structure if:
- Yield is reported, but pulp loss is not visible by shift
- Moisture failures are tracked, but upstream causes are not linked
- Water use rises without a clear process explanation
- Wastewater load increases during certain root lots
- Operators adjust hydrocyclones frequently without recorded reason
- Enzyme use is tracked as cost, not as a controlled process input
- Downtime categories are too broad to guide action
- Procurement decisions are made without plant performance data
A dashboard should reduce debate. It should make the next action clearer.
How ManiFlow Catalytics supports KPI-driven enzyme programs
ManiFlow Catalytics works with cassava starch factories that want enzyme supply connected to real production outcomes, not generic claims.
We support:
- Process review around slurry behavior, separation and loss points
- Practical dosing recommendations aligned with plant constraints
- Trial planning with measurable KPIs
- Support for dose discipline and handling practices
- Procurement risk reduction through reliable supply planning
- KPI interpretation across raw material changes and seasonal variation
The goal is simple: help your team run steadier, recover more value from the same roots, and make enzyme decisions with evidence.
Request a quote for your cassava starch line
If your factory is reviewing yield loss, pulp starch, slurry viscosity, water use, wastewater load or downtime, ManiFlow Catalytics can help you evaluate where enzyme support may fit.
Request a quote and share your process constraints, target KPI, production volume and current pain points. We will respond with a practical supply and dosing discussion built around your line.